ID3算法
ID3算法介绍
ID3算法原理
机器学习算法其实很古老,作为一个码农经常会不停的敲if, else if, else,其实就已经在用到决策树的思想了。只是你有没有想过,有这么多条件,用哪个条件特征先做if,哪个条件特征后做if比较优呢?怎么准确的定量选择这个标准就是决策树机器学习算法的关键了。1970年代,一个叫昆兰的大牛找到了用信息论中的熵来度量决策树的决策选择过程,方法一出,它的简洁和高效就引起了轰动,昆兰把这个算法叫做ID3(Iterative Dichotomiser 3),翻译过来就叫迭代二叉树三代。
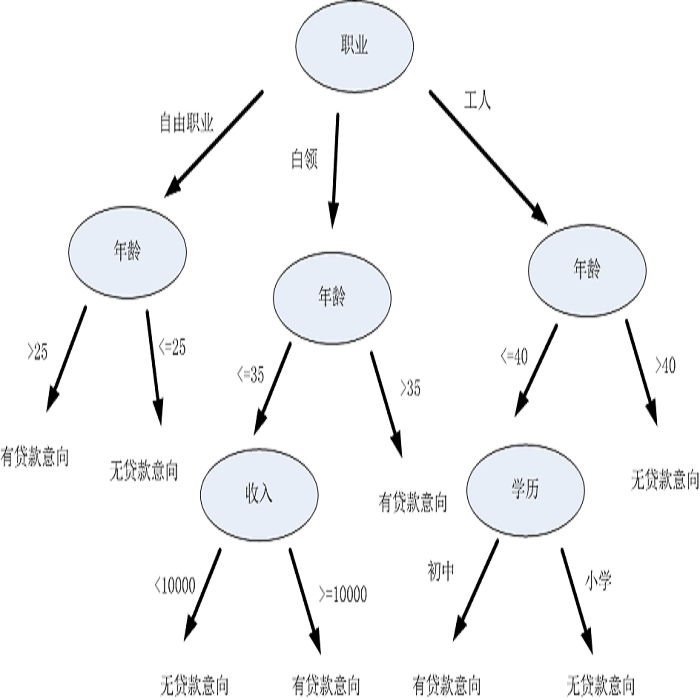
到ID3算法就是用信息增益大小来判断当前节点应该用什么特征来构建决策树,用计算出的信息增益最大的特征来建立决策树的当前节点。
算法的具体过程为
- 初始化信息增益的阈值
- 判断样本是否为同一类输出 ,如果是则返回单节点树T。标记类别为
- 判断特征是否为空,如果是则返回单节点树T,标记类别为样本中输出类别D实例数最多的类别。
- 计算X中的各个特征(一共n个)对输出D的信息增益,选择信息增益最大的特征
- 如果 的信息增益小于阈值 ,则返回单节点树T,标记类别为样本中输出类别D实例数最多的类别。
- 否则,按特征 的不同取值 i将对应的样本输出D分成不同的类别 。每个类别产生一个子节点。对应特征值为 。返回增加了节点的数T。
- 对于所有的子节点,令 , 递归调用2-6步,得到子树 并返回。
一个例子
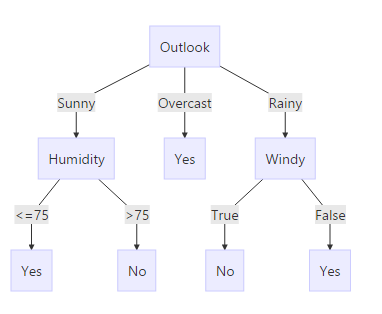
下面在天气情况与去不去打高尔夫之间的关系的数据集上使用ID3算法建立决策树。
| Day | Outlook | Temperature | Humidity | Windy | Play Golf? |
|---|---|---|---|---|---|
| 1 | Sunny | 85 | 85 | False | No |
| 2 | Sunny | 80 | 90 | True | No |
| 3 | Overcast | 83 | 78 | False | Yes |
| 4 | Rainy | 70 | 96 | False | Yes |
| 5 | Rainy | 68 | 80 | False | Yes |
| 6 | Rainy | 65 | 70 | True | No |
| 7 | Overcast | 64 | 65 | True | Yes |
| 8 | Sunny | 72 | 95 | False | No |
| 9 | Sunny | 69 | 70 | False | Yes |
| 10 | Rainy | 75 | 80 | False | Yes |
| 11 | Sunny | 75 | 70 | True | Yes |
| 12 | Overcast | 72 | 90 | True | Yes |
| 13 | Overcast | 81 | 75 | False | Yes |
| 14 | Rainy | 71 | 80 | True | No |
回顾一下信息增益的公式为:
计算出是否打高尔夫的信息熵可以得到:
设定信息增益的阈值为0.94
计算各个因变量的条件熵可以得到:
(在分析温度和湿度变量时使用>75和<=75 将两个样本分为两类)
同理可得:
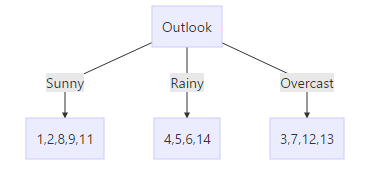
所以信息增益最大的特征为天气。
按照天气对数据进行分组可以得到下面的结果:
叶节点的内容为日子的编号。
针对第一个子树,可以得到
出去Outlook变量的其他三者变量为:
所以按照湿度继续对Sunny类别下的1,2,8,9,11 天进行分类。
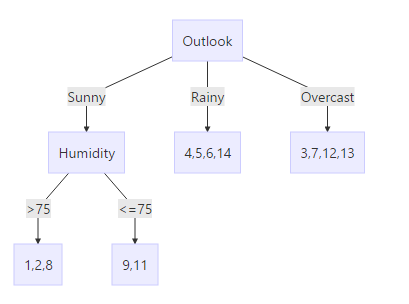
对比可得1,2,8 天不去打球,9,11 去打球,
因此
可以得到:
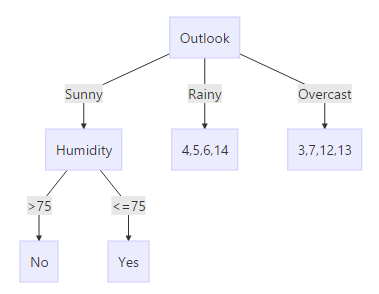
对其他子类下的也可以按照一样的方式计算,最终可以得到:
代码实现
from  import log
import operator

def createDataSet():#创建一个样例数据集
    dataSet = [[1, 1, 'yes'],
               [1, 1, 'yes'],
               [1, 0, 'no'],
               [0, 1, 'no'],
               [0, 1, 'no']]
    labels = ['no surfacing','flippers']
    #change to discrete values
    return dataSet, labels

def calcShannonEnt(dataSet):#香农熵计算函数
    numEntries = len(dataSet)
    labelCounts = {}
    for featVec in dataSet: #the the number of unique elements and their occurance
        currentLabel = featVec[-1]
        if currentLabel not in labelCounts.keys(): labelCounts[currentLabel] = 0
        labelCounts[currentLabel] += 1
    shannonEnt = 0.0
    for key in labelCounts:
        prob = float(labelCounts[key])/numEntries
        shannonEnt -= prob * log(prob,2) #log base 2
    return shannonEnt

def splitDataSet(dataSet, axis, value):#按照给定特征划分数据集
    retDataSet = []
    for featVec in dataSet:
        if featVec[axis] == value:
            reducedFeatVec = featVec[:axis]     #chop out axis used for splitting
            reducedFeatVec.extend(featVec[axis+1:])
            retDataSet.append(reducedFeatVec)
    return retDataSet

def chooseBestFeatureToSplit(dataSet):#选择信息增益最大的属性划数据
    numFeatures = len(dataSet[0]) - 1      #the last column is used for the labels
    baseEntropy = calcShannonEnt(dataSet)
    bestInfoGain = 0.0; bestFeature = -1
    for i in range(numFeatures):        #iterate over all the features
        featList = [example[i] for example in dataSet]#create a list of all the examples of this feature
        uniqueVals = set(featList)       #get a set of unique values
        newEntropy = 0.0
        for value in uniqueVals:
            subDataSet = splitDataSet(dataSet, i, value)
            prob = len(subDataSet)/float(len(dataSet))
            newEntropy += prob * calcShannonEnt(subDataSet)
        infoGain = baseEntropy - newEntropy     #calculate the info gain; ie reduction in entropy
        if (infoGain > bestInfoGain):       #compare this to the best gain so far
            bestInfoGain = infoGain         #if better than current best, set to best
            bestFeature = i
    return bestFeature                      #returns an integer

#如果把所有特征都消耗完了,叶子结点的类标签仍然不是唯一的,我们需要用多数投票的方式定义该节点
def majorityCnt(classList):
    classCount={}
    for vote in classList:
        if vote not in classCount.keys(): classCount[vote] = 0
        classCount[vote] += 1
    sortedClassCount = sorted(classCount.iteritems(), key=operator.itemgetter(1), reverse=True)
    return sortedClassCount[0][0]

def createTree(dataSet,labels):#递归构建算法
    classList = [example[-1] for example in dataSet]
    if classList.count(classList[0]) == len(classList):
        return classList[0]#stop splitting when all of the classes are equal
    if len(dataSet[0]) == 1: #stop splitting when there are no more features in dataSet
        return majorityCnt(classList)
    bestFeat = chooseBestFeatureToSplit(dataSet)
    bestFeatLabel = labels[bestFeat]
    myTree = {bestFeatLabel:{}}
    del(labels[bestFeat])
    featValues = [example[bestFeat] for example in dataSet]
    uniqueVals = set(featValues)
    for value in uniqueVals:
        subLabels = labels[:]       #copy all of labels, so trees don't mess up existing labels
        myTree[bestFeatLabel][value] = createTree(splitDataSet(dataSet, bestFeat, value),subLabels)#递归
    return myTree

#将测试数据应用到已经训好的决策树上
def classify(inputTree,featLabels,testVec):
    firstStr = inputTree.keys()[0]
    secondDict = inputTree[firstStr]
    featIndex = featLabels.index(firstStr)
    key = testVec[featIndex]
    valueOfFeat = secondDict[key]
    if isinstance(valueOfFeat, dict):
        classLabel = classify(valueOfFeat, featLabels, testVec)
    else: classLabel = valueOfFeat
    return classLabel
参考资料
展开全文