推荐 :手把手教你用Flask轻松部署机器学习模型(附代码&链接)
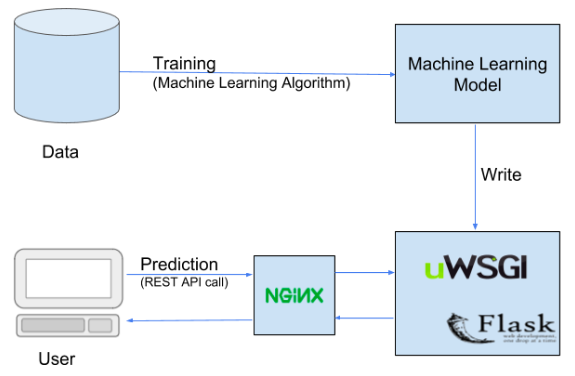
本文可以让你把训练好的机器学习模型使用Flask API 投入生产环境。
容易上手使用
内置开发工具和调试工具
集成单元测试功能
平稳的请求调度
详尽的文档
代码在哪里呢?
<!DOCTYPE html><html ><head><meta charset="UTF-8"><title>Deployment Tutorial 1</title><link href='https://fonts.googleapis.com/css?family=Pacifico' rel='stylesheet' type='text/css'><link href='https://fonts.googleapis.com/css?family=Arimo' rel='stylesheet' type='text/css'><link href='https://fonts.googleapis.com/css?family=Hind:300' rel='stylesheet' type='text/css'><link href='https://fonts.googleapis.com/css?family=Open+Sans+Condensed:300' rel='stylesheet' type='text/css'><link rel="stylesheet" href="{{ url_for('static', filename='css/style.css') }}"></head><body style="background: #000;"><div><h1>Sales Forecasting</h1><!-- Main Input For Receiving Query to our ML --><form action="{{ url_for('predict')}}"method="post"><input type="text" name="rate" placeholder="rate" required="required" /><input type="text" name="sales in first month" placeholder="sales in first month" required="required" /><input type="text" name="sales in second month" placeholder="sales in second month" required="required" /><button type="submit" class="btn btn-primary btn-block btn-large">Predict sales in third month</button></form><br><br> {{ prediction_text }}</div></body></html>
接下来,使用CSS对输入按钮、登录按钮和背景进行了一些样式设置。
@import url(https://fonts.googleapis.com/css?family=Open+Sans);html { width: 100%; height:100%; overflow:hidden;}body {width: 100%;height:100%;font-family: 'Helvetica';background: #000;color: #fff;font-size: 24px;text-align:center;letter-spacing:1.4px;}.login {position: absolute;top: 40%;left: 50%;margin: -150px 0 0 -150px;width:400px;height:400px;}
login h1 { color: #fff;text-shadow: 0 0 10px rgba(0,0,0,0.3);letter-spacing:1px;text-align:center;}input {width: 100%;margin-bottom: 10px;background: rgba(0,0,0,0.3);border: none;outline: none;padding: 10px;font-size: 13px;color: #fff;text-shadow: 1px 1px 1px rgba(0,0,0,0.3);border: 1px solid rgba(0,0,0,0.3);border-radius: 4px;box-shadow: inset 0 -5px 45px rgba(100,100,100,0.2), 0 1px 1px rgba(255,255,255,0.2);-webkit-transition: box-shadow .5s ease;-moz-transition: box-shadow .5s ease;-o-transition: box-shadow .5s ease;-ms-transition: box-shadow .5s ease;transition: box-shadow .5s ease;}
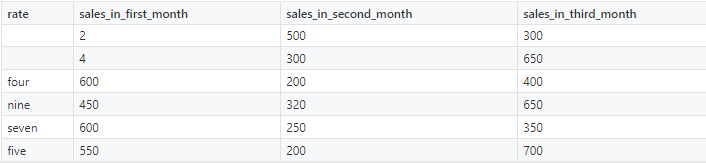
import numpy as npimport matplotlib.pyplot as pltimport pandas as pdimport pickledataset = pd.read_csv('sales.csv')dataset['rate'].fillna(0, inplace=True)dataset['sales_in_first_month'].fillna(dataset['sales_in_first_month'].mean(), inplace=True)X = dataset.iloc[:, :3]def convert_to_int(word):word_dict = {'one':1, 'two':2, 'three':3, 'four':4, 'five':5, 'six':6, 'seven':7, 'eight':8,'nine':9, 'ten':10, 'eleven':11, 'twelve':12, 'zero':0, 0: 0}return word_dict[word]X['rate'] = X['rate'].apply(lambda x : convert_to_int(x))y = dataset.iloc[:, -1]from sklearn.linear_model import LinearRegressionregressor = LinearRegression()regressor.fit(X, y)pickle.dump(regressor, open('model.pkl','wb'))model = pickle.load(open('model.pkl','rb'))print(model.predict([[4, 300, 500]]))
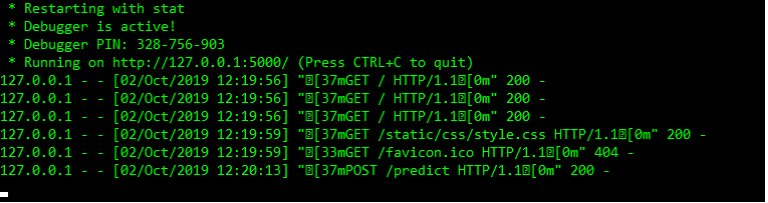
import numpy as npfrom flask import Flask, request, jsonify, render_templateimport pickleapp = Flask(__name__)model = pickle.load(open('model.pkl', 'rb'))@app.route('/')def home():return render_template('index.html')@app.route('/predict',methods=['POST'])def predict():int_features = [int(x) for x in request.form.values()]final_features = [np.array(int_features)]prediction = model.predict(final_features)output = round(prediction[0], 2)return render_template('index.html', prediction_text='Sales shouldbe $ {}'.format(output))@app.route('/results',methods=['POST'])def results():data = request.get_json(force=True)prediction = model.predict([np.array(list(data.values()))])output = prediction[0]return jsonify(output)if __name__ == "__main__":app.run(debug=True)
import requestsurl = 'http://localhost:5000/results'r = requests.post(url,json={'rate':5,'sales_in_first_month':200, 'sales_in_second_month':400})print(r.json()) Results
译者简介:申利彬,研究生在读,主要研究方向大数据机器学习。目前在学习深度学习在NLP上的应用,希望在THU数据派平台与爱好大数据的朋友一起学习进步。
END
转自:数据派THU 公众号;
版权声明:本号内容部分来自互联网,转载请注明原文链接和作者,如有侵权或出处有误请和我们联系。
合作请加QQ:365242293
数据分析(ID : ecshujufenxi )互联网科技与数据圈自己的微信,也是WeMedia自媒体联盟成员之一,WeMedia联盟覆盖5000万人群。

登录查看更多
相关内容

Flask is a microframework for Python based on Werkzeug, Jinja 2 and good intentions. And before you ask: It's BSD licensed!
http://flask.pocoo.org/
Arxiv
14+阅读 · 2018年5月19日


相关VIP内容
相关资讯
相关论文
Arxiv
14+阅读 · 2018年5月19日